Stór Focal
Irish Language Vocabulary Estimation
TL:DR I created an Irish language vocabulary test you can try out here
Introduction
In trying to improve my Irish I’ve been running through anki decks and thousands of words of vocabulary and wanted to find some place to test my vocabulary and benchmark my scores. There were plenty of testers online for different languages but I couldn’t find any for Irish. I then set out roughly 8 months ago to create an Irish version. After some trials and tribulations and refreshing a lot of my understanding of statistics I managed to put together a program that meets my needs. Feel free to try it out.
Generation of Frequency List
I was able get a list of words and frequencies, I can’t remember the exact location since I found it a year
ago but it was similar to this list from Michal Boleslav Měchura here but messier and needed cleaning up.
I used a bash script and a little python to normalise the data and remove any acronyms, proper nouns, or others
using lists from professor Kevin Scannell.
Exponential Distribution Sampling
The frequency of the words follows an exponential distribution where more common words are at the start
and at the end are words that you may only see used once ever and never again.
If you sampled in even sections across the list then you would get rarer words more often in your sample.
To achieve a decent sample that would test their knowledge we would want to get more words from the
start and then progressively fewer words as the frequency decreases. There is no point asking people
10 of the most complicated words and judging from there. You would get a better picture from asking 10
more common words.
To get the samples from 0 to i where i is the number to generate we get a random number 0-1 with
Math.random() denoted by u_i we can use the formula -ln(u_i)/lambda. Lambda is the rate of decay
or 1/mean for the exponential distribution. This number rounded down is the index for the sampled
words from the list of words.
Maximum Likelihood Estimation for an Exponential Distribution
Maximum likelihood estimation makes the vocabulary estimation possible. An MLE can be used along with
the sampled known and unknown words as parameters to create a probablity distribution with the tail
being the number of words known, estimated of course. This involves some more complicated maths than
I’d usually have to write but I’m thankful that people with PhDs have written out solutions before
including this great one from Dr Fred Farrell here.
I took Dr Farrell’s code, did a small bit of tidying, updated the scipy optimisation function for a
more modern one, added error handling, and set it up as a Google Cloud Function that acts as an API
that can be called from the website with the known and unknown words as parameters in the request.
I wasted a lot of time trying to write a robust mathematical library in javascript that mimicked the
functionality of the scipy code but then realised that the best code is often times the code you don’t
write.
Generation of a Bell Curve
The generation of a bell curve (normal distribution) is not a built-in feature in a lot of javascript graphing libraries. The ones I did see seemed too involved or over-designed for my needs. Instead of using a CDN for a graphing library or rolling my own from scratch I took a simplier more sneaky approach. I got an image of a bell curve, painted it a solid colour using photoshop then made another copy with a different shade. I used one to be fixed on the screen and the second darker one was used as a relative overlay on top of the other bell curve.
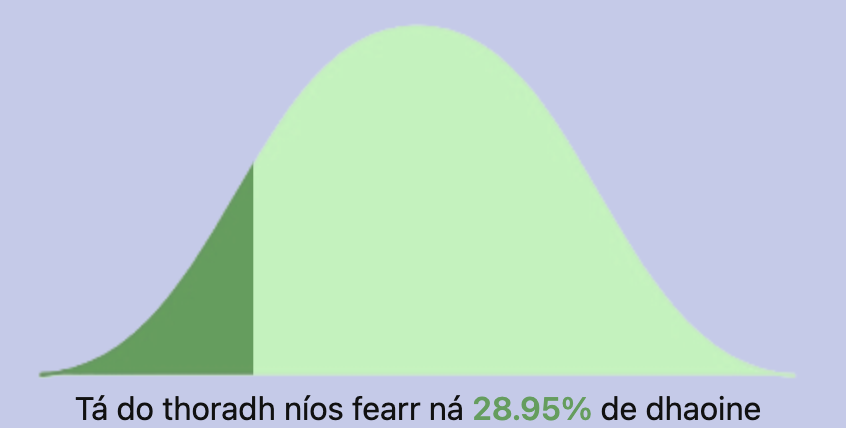
To get the right size for the overlay bell curve I just use the clip-path css property to cut out a certain percentage of the image. I know this isn’t the most accurate to the area under the curve but can be updated at a later stage.
document.getElementById('masc').style.clipPath = `polygon(0 0, ${céatadán}% 0, ${céatadán}% 100%, 0 100%)`;
In terms of the actual numbers we would need to find the z-score given the user’s score and convert it
to a percentage.
As far as I am aware there isn’t quantitative research into the mean and standard deviation of Irish speaker’s
vocabulary sizes as you would find for other languages such in this study
I took approximate values for the mean and standard deviation plugged them into a formula to get the z-score
$$ Z = (x - \mu) \over \sigma $$
Z = (result - mean) / standard deviation
I plugged the z-score into a terse function borrowed from Dennis Iversen, John Walker, and Gary Perlman that you can find on Github here
Still to Work on
Not having any previous figures of Irish language speaker vocabulary, I had to guess approximate numbers
based on other sources.
The Google Cloud function prints the result to the logs though before sending the response back to the
website so given enough attempts it would be possible to generate some fiThe gures that would be more
accurate than pure guess work.
The knowledge of the words is based on what the user self declares for each question. The final result
is therefore based on a trust with the user and there is nothing stopping them clicking “Tuigim” for every
word. Other online language vocabulary tests have gotten around this problem by offering a selection of
four words and asking which of the four are a synonym or antonym to a given word. While this can also be
cheated it at least has a better chance of proving a user’s actual knowledge.
Rather than a random selection from thousands of words, a hand chosen list of say 50 words could be picked
and antonyms and synonyms along with wrong answers constructed for each of the 50 words. This would allow
a smaller number of possible scores but would work better in blind tests.
Update
After running for a day we can take a look at some of the results from the Cloud Function logs.
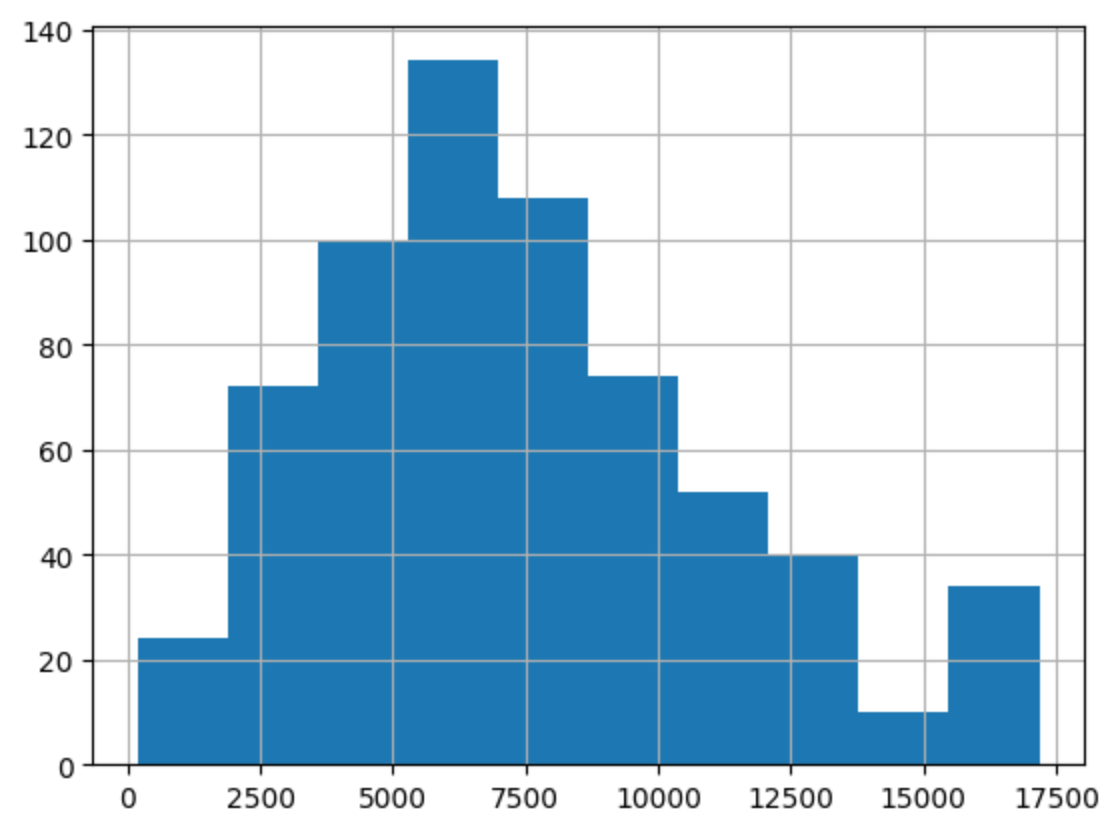 Here we have a nice histogram showing a slightly right skewed distribution. You can also note the larger
number of high scores than expected at the end most likely from people just spamming the ‘Tuigim’ button.
Here we have a nice histogram showing a slightly right skewed distribution. You can also note the larger
number of high scores than expected at the end most likely from people just spamming the ‘Tuigim’ button.
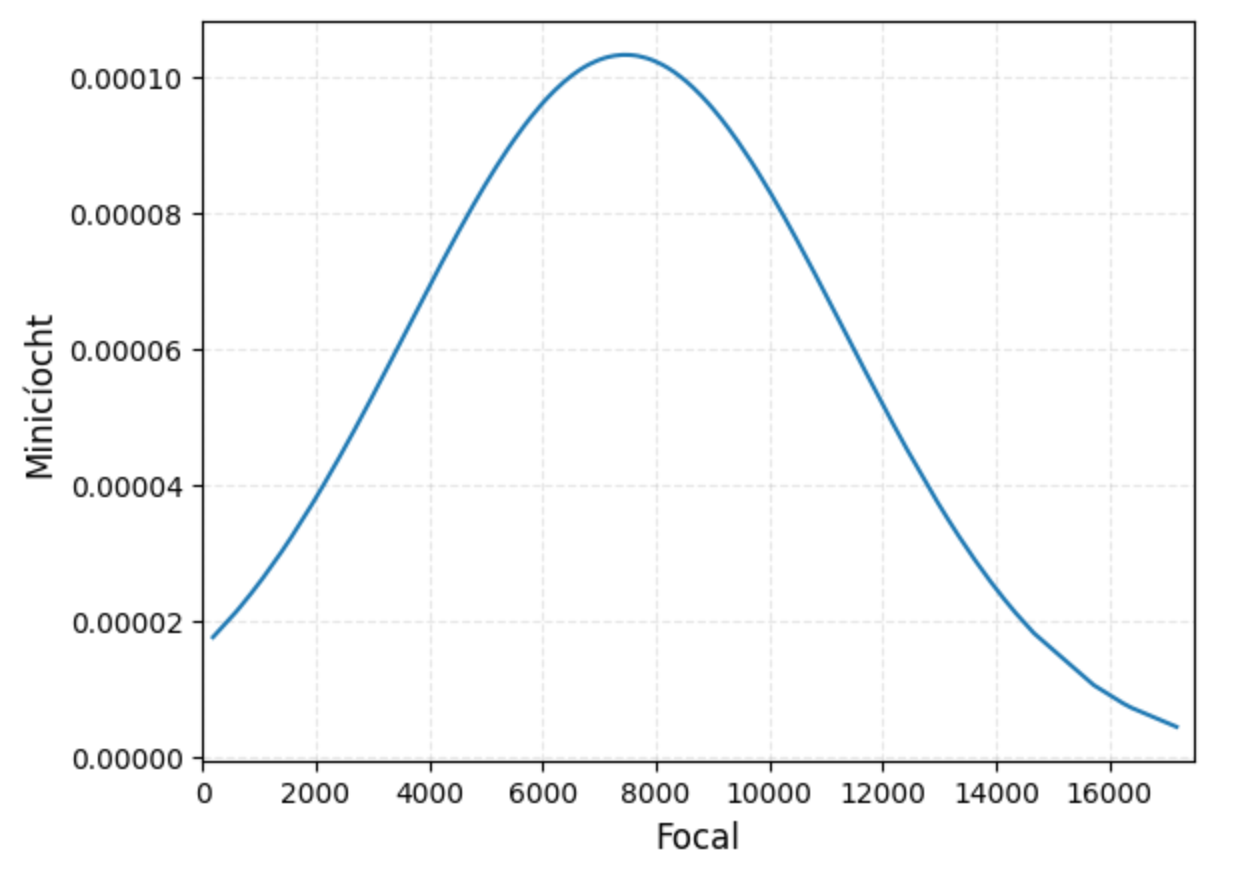 Above is the probability density function that gives us a smoother view of how the results turned out.
Using the dataset we can construct more accurate means and standard deviations from which to compare
to others on the bell curve with.
After removing the outliers we get values of:
mean = 7020.41
standard deviation = 3338.47