Emergency Distances
A&E Driving Distances in Ireland
TL:DR
Check out « this map » to see how far you are from a 🏥 hospital emergency department  .
.
Update: As featured in Galway Beo
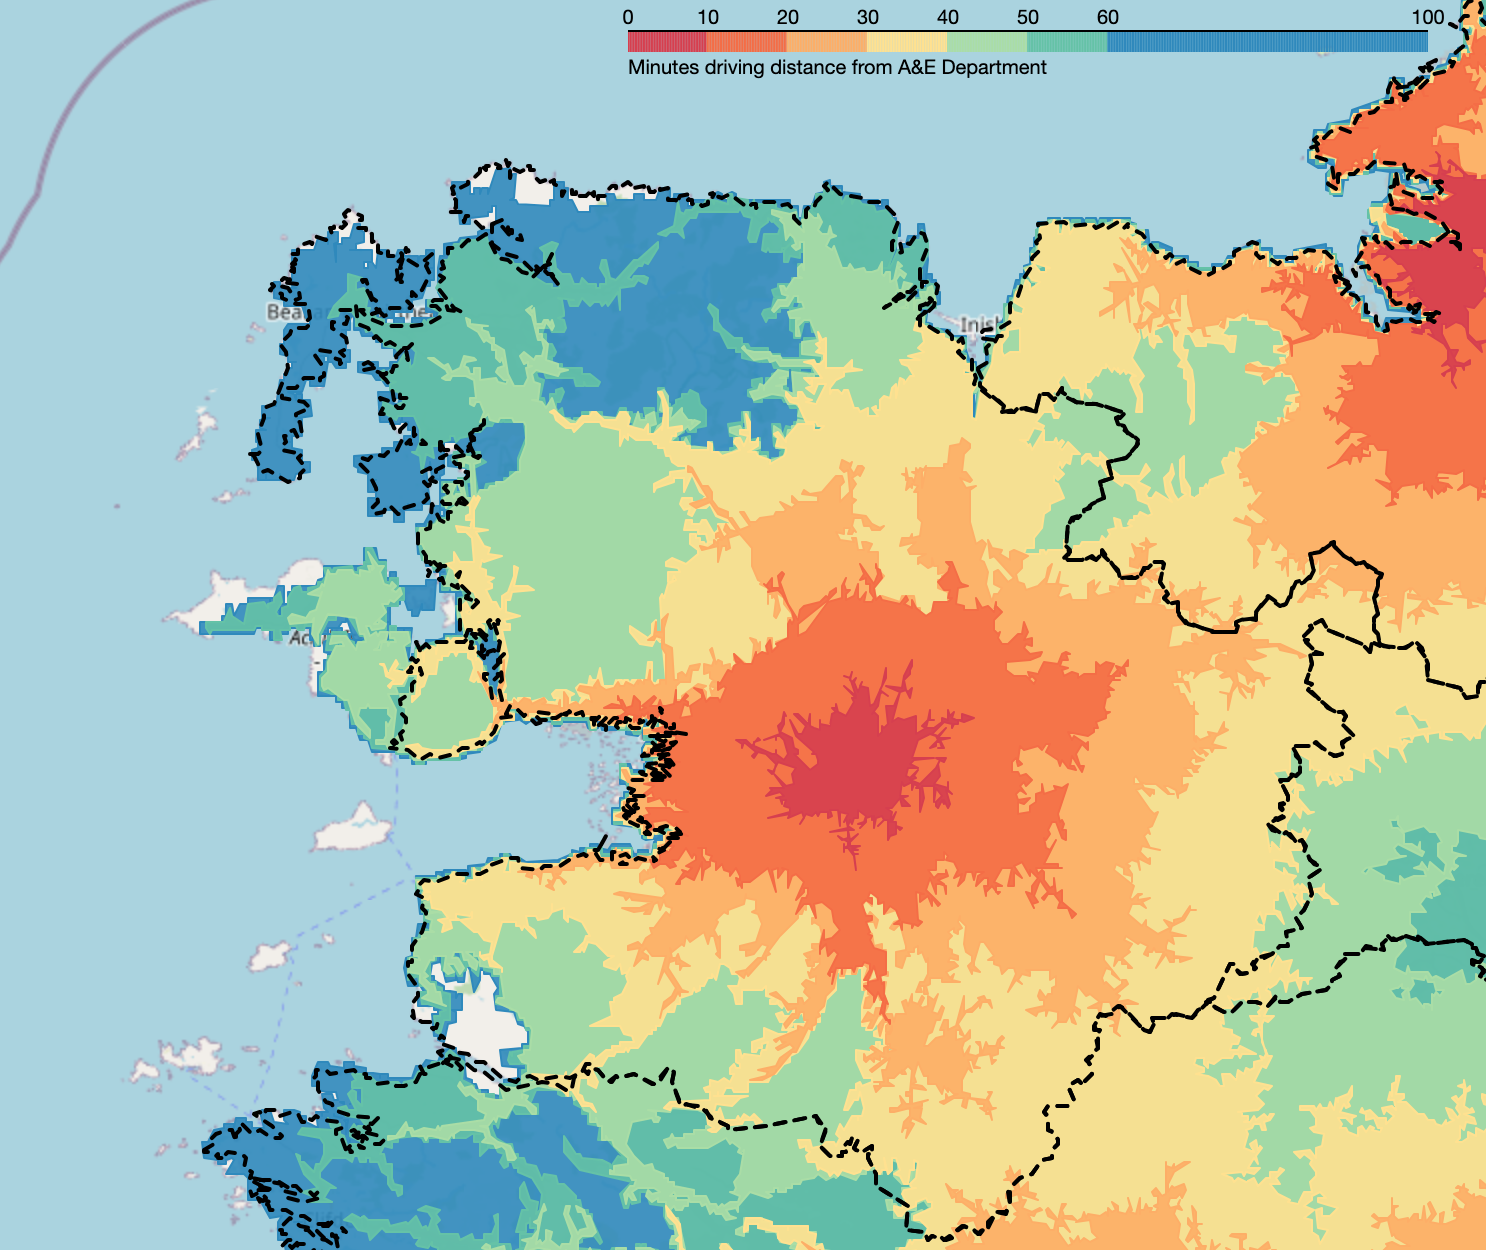 Example shot of distances from Mayo University Hospital
Introduction
The data and map generated highlight the investment towards certain parts of the country and where hospital services are lacking. Particularly the west coast is faced with longer travel times that could make all the difference in an emergency.
If you wanted to find out how far your house was from the 🏥 A&E incase anything cropped up you’d have to go to Google Maps and check manually. What if you wanted to see how far every house in the entirety of Ireland is from an 🏥 A&E? Well this map computes every possible route down every possible road in Ireland and compiles it into one scrollable interactive map.
The full county map is available here
Figures
See the table for the entire list of 🏥 A&E coverages per county. Most countries have a distance coverage percentage for most of the population. Some counties such as Westmeath, Tyrone, Kilkenny, etc. have 100% coverage under 60 minutes meaning everyone in these counties can reach an A&E department in under 1 hour. Meanwhile Kerry has the lowest with only 78.5 of area in Kerry able to reach an 🏥 A&E department in under 1 hour.
| county name | 10 min percentage | 20 min percentage | 30 min percentage | 40 min percentage | 50 min percentage | 60 min percentage | 100 min percentage | total area (m^2) |
|---|---|---|---|---|---|---|---|---|
| Louth | 10.58 | 64.92 | 98.04 | 99.25 | 99.47 | 99.8 | 99.98 | 824697424.38 |
| Sligo | 5.38 | 28.75 | 61.49 | 87.48 | 98.65 | 99.18 | 99.59 | 1832320861.46 |
| Westmeath | 3.86 | 44.62 | 87.5 | 98.14 | 100.0 | 100.0 | 100.0 | 1835094872.09 |
| Tyrone | 0.41 | 12.05 | 49.78 | 87.03 | 99.54 | 100.0 | 100.0 | 3258041212.65 |
| Limerick | 3.12 | 20.81 | 51.48 | 86.07 | 96.65 | 97.49 | 98.11 | 2750581255.19 |
| Waterford | 5.18 | 19.5 | 43.2 | 61.95 | 94.83 | 99.49 | 99.84 | 1858789078.95 |
| Kilkenny | 2.86 | 42.79 | 90.56 | 100.0 | 100.0 | 100.0 | 100.0 | 2067787314.53 |
| Carlow | 0.0 | 0.61 | 28.81 | 80.51 | 97.5 | 100.0 | 100.0 | 894867772.0 |
| Cork | 2.04 | 10.55 | 28.27 | 57.44 | 76.72 | 86.4 | 98.3 | 7492154677.75 |
| Derry | 8.8 | 38.23 | 78.01 | 93.27 | 99.36 | 99.69 | 99.85 | 2116426989.94 |
| Leitrim | 0.11 | 6.84 | 30.99 | 66.25 | 99.58 | 100.0 | 100.0 | 1585155409.84 |
| Clare | 0.03 | 4.0 | 15.19 | 33.68 | 58.02 | 84.11 | 94.83 | 3443295248.39 |
| Kildare | 7.11 | 51.2 | 89.95 | 100.0 | 100.0 | 100.0 | 100.0 | 1691176098.19 |
| Monaghan | 0.0 | 1.28 | 28.38 | 93.04 | 100.0 | 100.0 | 100.0 | 1291778233.81 |
| Fermanagh | 7.96 | 46.42 | 94.17 | 100.0 | 100.0 | 100.0 | 100.0 | 1846868979.96 |
| Galway | 1.46 | 12.28 | 36.32 | 59.32 | 76.93 | 88.06 | 97.58 | 6157406937.9 |
| Mayo | 1.94 | 15.09 | 31.56 | 59.84 | 78.72 | 84.36 | 94.95 | 5585170772.02 |
| Laois | 6.78 | 47.52 | 83.35 | 99.87 | 100.0 | 100.0 | 100.0 | 1716199480.56 |
| Longford | 0.0 | 0.29 | 37.8 | 82.56 | 98.69 | 100.0 | 100.0 | 1089403518.68 |
| Donegal | 2.69 | 17.78 | 35.54 | 65.54 | 86.55 | 92.84 | 97.68 | 4848038019.81 |
| Roscommon | 0.44 | 7.24 | 21.73 | 48.82 | 86.46 | 100.0 | 100.0 | 2543058640.37 |
| Offaly | 4.23 | 28.56 | 71.24 | 97.15 | 100.0 | 100.0 | 100.0 | 1997178392.14 |
| Kerry | 1.87 | 12.55 | 33.86 | 49.74 | 60.54 | 78.5 | 96.43 | 4799098649.65 |
| Meath | 7.67 | 56.42 | 89.88 | 99.98 | 99.98 | 100.0 | 100.0 | 2337675154.57 |
| Dublin | 30.54 | 87.02 | 98.88 | 99.24 | 99.27 | 99.43 | 99.58 | 927222522.91 |
| Armagh | 15.99 | 62.67 | 91.08 | 95.73 | 100.0 | 100.0 | 100.0 | 1322897039.7 |
| Antrim | 7.98 | 47.67 | 75.71 | 86.92 | 98.45 | 99.41 | 99.5 | 3088251938.77 |
| Down | 5.44 | 43.86 | 74.25 | 95.69 | 99.25 | 99.61 | 99.67 | 2492890657.18 |
| Tipperary | 1.4 | 11.89 | 37.89 | 75.99 | 97.37 | 99.07 | 100.0 | 4297626758.73 |
| Wicklow | 0.0 | 5.34 | 26.95 | 55.18 | 89.03 | 99.75 | 99.94 | 2020001614.15 |
| Cavan | 1.95 | 29.92 | 76.31 | 96.71 | 100.0 | 100.0 | 100.0 | 1927778805.91 |
| Wexford | 3.78 | 32.94 | 72.11 | 95.04 | 98.48 | 99.38 | 99.66 | 2372348207.48 |
Population Coverage
By taking existing census data in Ireland we can roughly work out how much of the population each of these areas cover.
Taking the Deprivation Index dataset which has an expansive list of small areas (over 14,000 across 26 counties) with corresponding population counts. Taking Laois as an example we can find the intersection for each timed area and the small areas from the deprivation index. Calculating rough figures we get:
| county name | 10 min population | 20 min population | 30 min population | 40 min population | 50 min population | 60 min population | 100 min population |
|---|---|---|---|---|---|---|---|
| Laois | 39706 | 78070 | 91448 | 91877 | 91877 | 91877 | 91877 |
Seeing how 99.87% of the county area wise is able to get to an A&E department in less than 40 minutes it seems reasonable that our population count tops out at 91,877, close to the estimated 2023 count of 91,657 people.
We can also see that 39706/91877 x 100 = 43.22% of the population of Laois can reach an A&E department in less than 10 mintues!
Conclusion
The technology behind the map is easy to update for future hospital plans while being very low cost to run. Data science is a necessary tool that can be leveraged to promote a more equitable society in Ireland that provides equally of access to health services throughout the Ireland North and South.
Technial Details
Here’s the technical details for how I made it work
Routing
The first step of creating the map was compiling a list of A&E departments combining these two lists:
Packaging it as a csv file:
| name | type | lat | lon |
|---|---|---|---|
| Mayo University Hospital | hospital | 53.8586987 | -9.3057666 |
| Sligo University Hospital | hospital | 54.2742179 | -8.46534 |
| University Hospital Galway | hospital | 53.2768492 | -9.0686869 |
| Portiuncula University Hospital | hospital | 53.3267853 | -8.2354909 |
| Beaumont Hospital | hospital | 53.3886228 | -6.2298697 |
| Cavan General Hospital | hospital | 54.001614 | -7.3721102 |
| Connolly Hospital Blanchardstown | hospital | 53.3883035 | -6.3733538 |
| Cork University Hospital | hospital | 51.8828831 | -8.5123853 |
| Letterkenny University Hospital | hospital | 54.9599749 | -7.7341944 |
| Mater Misericordiae University Hospital | hospital | 53.3601096 | -6.265246 |
| Mercy Hospital | hospital | 51.9016319 | -8.5023249 |
| Midland Regional Hospital Portlaoise | hospital | 53.0382084 | -7.2760839 |
| Midland Regional Hospital Tullamore | hospital | 53.2830682 | -7.4884664 |
| Naas General Hospital | hospital | 53.2113718 | -6.6610156 |
| Our Lady of Lourdes Hospital Drogheda | hospital | 53.7222147 | -6.354332 |
| Our Lady’s Hospital Navan | hospital | 53.6509365 | -6.6965478 |
| Regional Hospital Mullingar | hospital | 53.5339849 | -7.3488692 |
| St James’ Hospital | hospital | 53.339302 | -6.3010192 |
| St Luke’s General Hospital | hospital | 52.6665445 | -7.2622519 |
| St Vincent’s University Hospital | hospital | 53.3168588 | -6.2145806 |
| Tallaght University Hospital | hospital | 53.2825903 | -6.6420337 |
| Tipperary University Hospital | hospital | 52.3552083 | -7.7136177 |
| University Hospital Kerry | hospital | 52.2652569 | -9.6886432 |
| University Hospital Limerick | hospital | 52.6351824 | -8.6538597 |
| University Hospital Waterford | hospital | 52.2485059 | -7.0784959 |
| Wexford General Hospital | hospital | 52.3430674 | -6.4827788 |
| Royal Victoria Hospital | hospital | 54.5944794 | -5.9568094 |
| Causeway Area Hospital | hospital | 55.1242238 | -6.6537714 |
| Craigavon Area Hospital | hospital | 54.4343794 | -6.4135847 |
| Daisy Hill Hospital | hospital | 54.1789493 | -6.3527515 |
| Mater Hospital Crumlin Road | hospital | 54.6085403 | -5.9430679 |
| Antrim Area Hospital | hospital | 54.7332802 | -6.191414 |
| Altnagelvin Area Hospital | hospital | 54.9861244 | -7.2933306 |
| South West Acute Hospital | hospital | 54.366971 | -7.636536 |
I was able to use a routing engine to find the distances you can travel from given locations. There are various online options but for server intensive operations I chose to use an open-source alternative that can be run on a local machine. I installed Valhalla locally, and created a short python script to interface with the routing engine and produce the geojson data
{
  "Mayo University Hospital": {
    "features": [
      {
        "properties": {
          "fill-opacity": 0.33,
          "fill": "##D53F4F",
          "fillColor": "##D53F4F",
          "color": "##D53F4F",
          "fillOpacity": 0.33,
          "opacity": 0.33,
          "contour": 10,
          "metric": "time"
        },
        "geometry": {
          "coordinates": [
            [
              -9.226767,
              53.943009
            ],
            [
              -9.227811,
              53.942699
            ],
...
Creating the map
Here is the full set of helpful python libraries I used for this project
import csv
import json

import branca
import folium
import selenium

import geopandas as gpd
import matplotlib.pyplot as plt
import pandas as pd

from area import area
from shapely import to_geojson
from shapely.geometry import Polygon
from shapely.ops import unary_union
We that set we can load in the hospital data
with open("valhalla_county_routing_data.json", "r") as json_file:
  valhalla_data = json.load(json_file)
We need to take all the 10 minute, 20 minute, etc. sections on the map and join the polygons together
# Split into groups of NUMBER_OF_BUCKETS
v_isochrone_coords = [[] for _ in range(NUMBER_OF_BUCKETS)]
for loc in valhalla_data.keys():
  for index, buc in enumerate(valhalla_data[loc]["features"]):
      v_isochrone_coords[index % NUMBER_OF_BUCKETS].append(Polygon(buc["geometry"]["coordinates"]))

# Merge polygons
v_merged_isochrones = [[] for _ in range(NUMBER_OF_BUCKETS)]
for index, iso in enumerate(v_isochrone_coords):
  v_merged_isochrones[index] = unary_union(iso)
County Outlines
To break it down for each county I had to get the GeoJSON data for the area covered. There was plenty of files online for council districts but not many for county boundaries. Most only included 26 counties, I was able to find a 32 county file here thanks to Martin Peters. I updated the Irish Language names due to some name corruption because of the fadas and made the whole file accessible here.
Folium was used for creating the maps from all the collected data
gdf_bucket = gpd.GeoDataFrame(geometry=v_merged_isochrones,
                              crs='EPSG:4326')
counties_gdf = gpd.GeoDataFrame(geometry=list(counties.values()), crs='EPSG:4326')

county_map = folium.Map(location=map_center,
                        zoom_start=7,
                        zoom_control=True,
                        tiles='OpenStreetMap')

folium.GeoJson(gdf_bucket, style_function=colouring).add_to(county_map)
folium.GeoJson(counties_gdf, style_function=county_outline).add_to(county_map)
Branca is used for the colour map legend at the top
branca.colormap.StepColormap(
    new_colour_map[::-1], vmin=0, vmax=100, index=[0, 10, 20, 30, 40, 50, 60, 100], caption='Minutes driving distance from A&E Department'
).add_to(county_map)
County Coverage
Now that we have the routing distances areas and the area for each county we can find the intersection for each distance bucket (10 minutes, 20 minutes, etc.) and compute the area out of the total.
county_areas = {}
for bucket in merged_isochrones:
  for county in counties.keys():
    intersection = counties[county].intersection(bucket)
    if county in county_areas:
      county_areas[county].append(area(intersection))
    else:
      county_areas[county] = [area(intersection)]
Population Estimates
I was able to join the Deprivation Index dataset with the existing county areas and the CSO Small Areas dataset on the small area id ED_ID_STR. By checking for an intersection in the Polygons and simply adding up the populations I was able to roughly esimate the counts for the population for each time bucket for each county.
For example:
bucket_pops = []
for bucket in merged_isochrones:
  b_pop = 0
  seen = set([])
  for loc in laois_coord_data:
    if loc['ED_ID_STR'] in deprivation_data and loc['ED_ID_STR'] not in seen and intersects(Polygon(loc['coordinates'][0][0]), bucket):
      b_pop += int(Decimal(deprivation_data[loc['ED_ID_STR']]['population'].replace(',', '')))
      seen.add(loc['ED_ID_STR'])
  bucket_pops.append(b_pop)